R
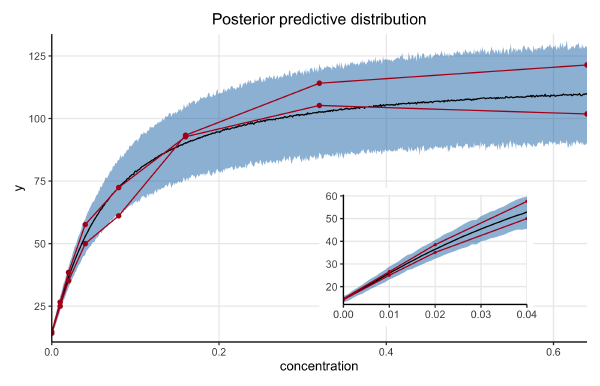
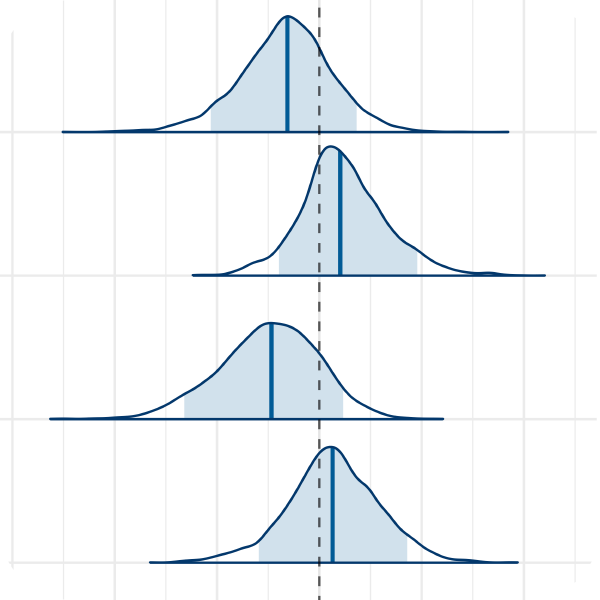
Non-linear model of serial dilutions with Stan
·1972 words·10 mins·
loading
·
loading
Modeling the standard curve of a standard dilution experiment with Stan as presented in Bayesian Data Analysis by Gelman et al.
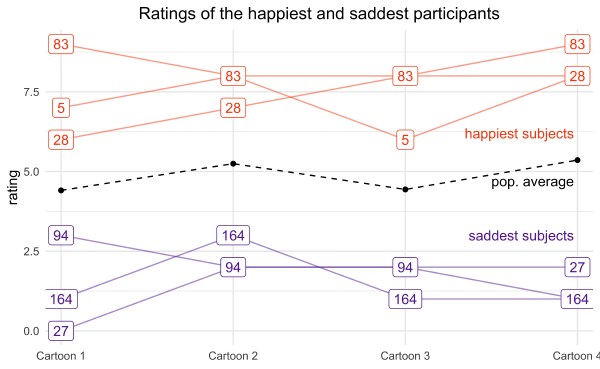
Conducting a Bayesian analysis with 'rstanarm' and publishing with 'distill'
·1204 words·6 mins·
loading
·
loading
A brief description of the tools and process behind my recent analysis of data from a study of the ‘Facial Feedback Hypothesis’.
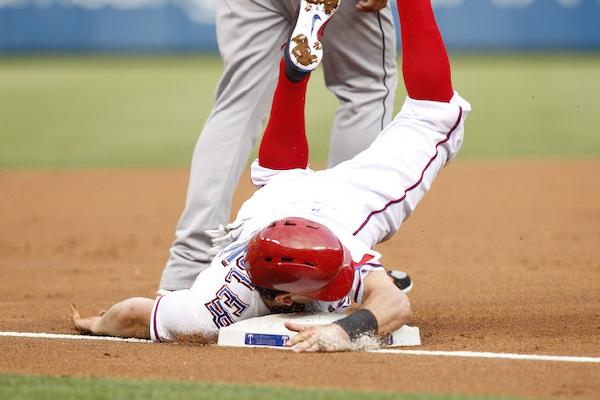
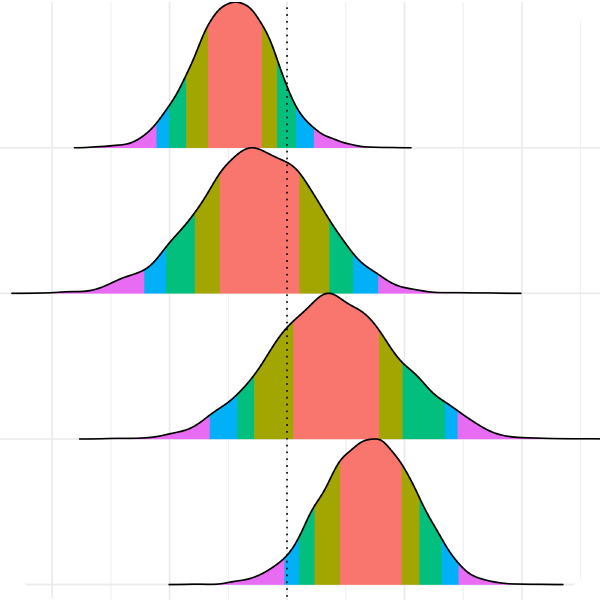
Riddler: Can You Beat MLB Recods?
A simple statistical solution to this Riddler accompanied by descriptive simulations.
Uncanny X-Men: Bayesian take on Dr. Silge’s analysis
·3138 words·15 mins·
loading
·
loading
I present a breif take on Dr. Silge’s Uncanny X-Men analysis using Bayesian methods.
Riddler: Can You Just Keep Turning?
Using simulation in R to solve this directionally-discombobulating puzzle.
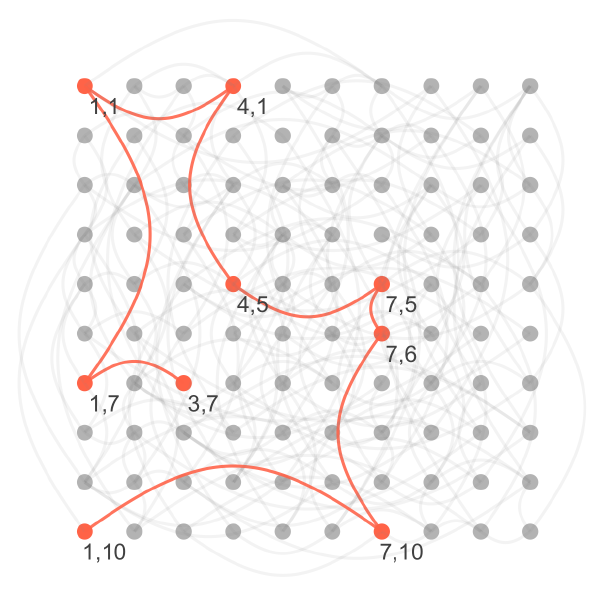
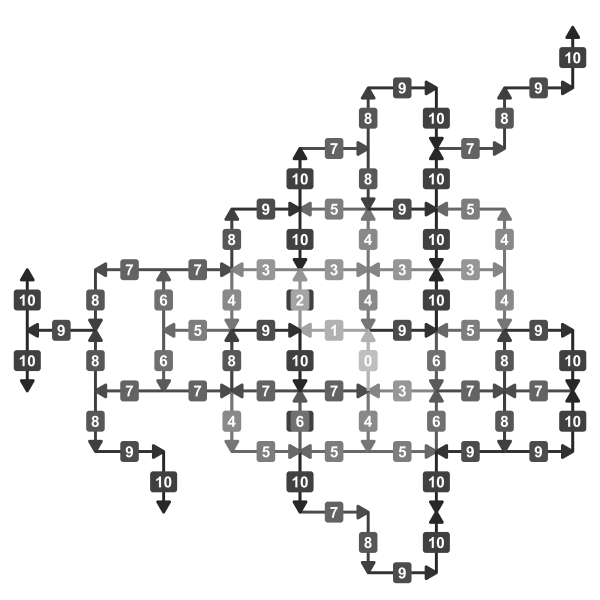
Riddler: Can you solve the not-so-corn maze?
How I used graph theory in R to solve a mathematical corn maze.

Riddler: Can You Track The Delirious Ducks?
I used simulations in R to solve this Riddler about how long it takes for confuded ducks to find each other in a pond.
Riddler: Can You Roll The Perfect Bowl?
I used simulation with to approximate the solution an older Riddler. I used an gradient descent-like method to gradually narrow in on a precise estimate.