FiveThirtyEight’s Riddler Express#
(Link to the original article.)
From Patrick Mayor comes a question about something we’re doing these days to keep ourselves and others safe: social distancing.
You’re walking along the middle of a wide sidewalk when you see someone walking toward you from the other direction, also down the middle of the sidewalk, 12 feet away. Being responsible citizens, you pass each other while maintaining a distance of at least 6 feet at all times. By the time you reach each other’s original positions, you should be back in the middle of the sidewalk again.
You should assume that the other person follows the same path you do, but flipped around (since they’re walking in the opposite direction). For example, you could both walk 3 feet to the left, 12 feet forward and finally 3 feet back to the right, walking a total of 18 feet before swapping positions.
Being lazy (I mean, efficient), you’d like to know the shortest distance you and the other person could walk so that you can switch positions, all while staying at least 6 feet apart at all times. What is this distance?
Plan#
I am basically going to simulate the process with very small time steps and track the location of each person. These points can then be used to measure the distance traveled by each person.
Setup#
knitr::opts_chunk$set(echo = TRUE, comment = "#>")

library(glue)
library(ggforce)
library(gganimate)
library(tidyverse)

theme_set(theme_minimal())Simulation#
Global constants#
Below are a few constants to define from the beginning. time_step_size
is the distance traveled at each time step of the simulation.
minimum_distance is the minimum safe distance that the two people need
to stay from each other.
time_step_size <- 0.01
minimum_distance <- 6Subroutines#
The update_tracker() function updates a data table with a person’s
current location for a given time step.
update_tracker <- function(pos, time_step, tracker_tib) {
    bind_rows(
        tracker_tib,
        tibble(x = pos[[1]], y = pos[[2]], t = time_step)
    )
}
The move_person() function moves a person left or right by a given
amount x.
move_person <- function(person, x, right = TRUE) {
    if (right) {
        person[[1]] <- person[[1]] + x
    } else {
        person[[1]] <- person[[1]] - x
    }
    return(person)
}
The shift_person() function shifts a person up or down by a given
about y.
shift_person <- function(person, y, down = TRUE) {
    if (down) {
        person[[2]] <- person[[2]] - y
    } else {
        person[[2]] <- person[[2]] + y
    }
    return(person)
}
The measure_distance() function measures the distances between two
((x, y)) coordinates a and b.
measure_distance <- function(a, b) {
    dist(matrix(c(a, b), nrow = 2, byrow = TRUE))[[1]]
}
Main simulation loop#
The following for-loop moves each person, A and B, towards each
other from 12 feet away. At each step, the distance between one another
is measured, and if they are too close to each other, they are slowly
moved apart until they are again safe. The movement of each person is
tracked in a data table.
One complication I ran into was how to move the people back towards the middle after they passed each other. Instead, I realized that the problem is symmetric, so I could just run the first half of the simulation - from 12 to 6 feet apart - and then use the symmetry to get the second half.
A <- c(0, 0)
B <- c(12, 0)

A_tracker <- update_tracker(A, 0, tibble())
B_tracker <- update_tracker(B, 0, tibble())

for (t in seq(time_step_size, 6, time_step_size)) {
    A <- move_person(A, time_step_size)
    B <- move_person(B, time_step_size, right = FALSE)

    while (measure_distance(A, B) < minimum_distance) {
        A <- shift_person(A, 0.01, down = TRUE)
        B <- shift_person(B, 0.01, down = FALSE)
    }

    A_tracker <- update_tracker(A, t, A_tracker)
    B_tracker <- update_tracker(B, t, B_tracker)
}
The plot below shows the path of A for the first half of the
simulation.
A_tracker %>%
    ggplot(aes(x = x, y = y)) +
    geom_line() +
    labs(title = "Person A's path or the first half of the simulation")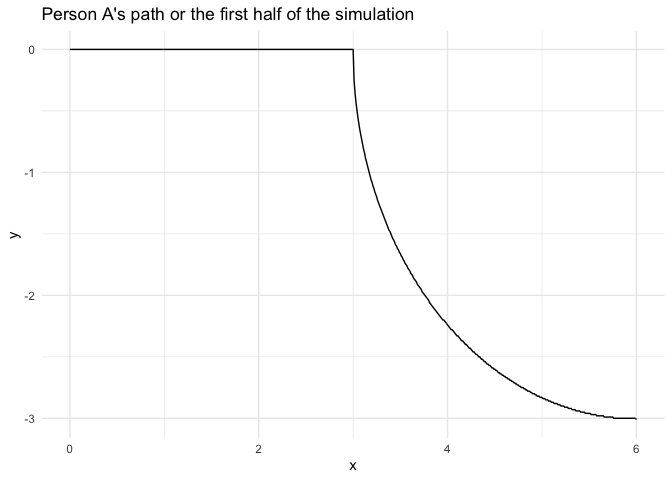
The simulation was completed by copying the tracker data tables for A
and B and combing these into a single people_tracker data table.
A_tracker <- bind_rows(
    A_tracker,
    A_tracker %>%
        mutate(x = 6 + x, y = rev(y), t = 6 + t) %>%
        filter(t != 6)
)

B_tracker <- bind_rows(
    B_tracker,
    B_tracker %>%
        mutate(x = x - 6, y = rev(y), t = 6 + t) %>%
        filter(t != 6)
)

ppl_tracker <- inner_join(A_tracker,
                          B_tracker,
                          by = "t",
                          suffix = c("_A", "_B"))
Finally, I could plot the paths taken by the two individuals while always remaining as close to the middle of the sidewalk as possible and keeping 6 feet apart.
ppl_tracker %>%
    mutate(y_A = y_A - 0.05,
           y_B = y_B + 0.05) %>%
    ggplot() +
    geom_line(aes(x = x_A, y = y_A), color = "red", size = 1.1) +
    geom_line(aes(x = x_B, y = y_B), color = "blue", size = 1.1) +
    coord_equal() +
    labs(x = "x", y = "y",
         title = "Social distancing paths")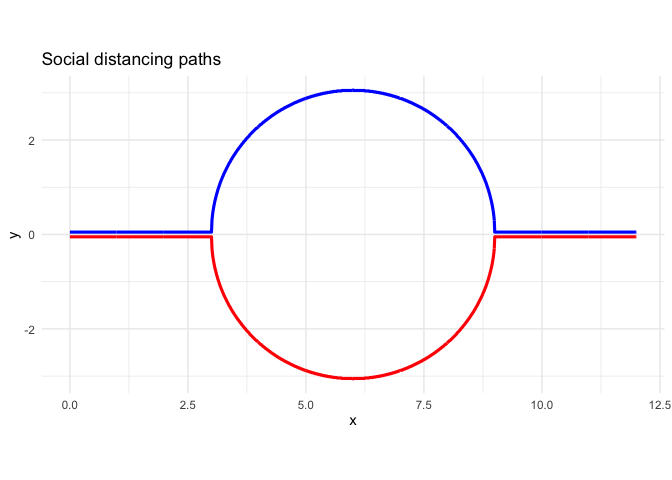
The social distancing rules guides are shown in the plot below, they they overlap a lot because there is no time dimension.
ppl_tracker %>%
    mutate(y_A = y_A - 0.05,
           y_B = y_B + 0.05) %>%
    ggplot() +
    geom_ribbon(aes(x = x_A,
                    ymin = y_A-minimum_distance, ymax = y_A+minimum_distance),
                fill = "red", color = NA, alpha = 0.1) +
    geom_ribbon(aes(x = x_B,
                    ymin = y_B-minimum_distance, ymax = y_B+minimum_distance),
                fill = "blue", color = NA, alpha = 0.1) +
    geom_line(aes(x = x_A, y = y_A), color = "red", size = 1.1) +
    geom_line(aes(x = x_B, y = y_B), color = "blue", size = 1.1) +
    coord_equal() +
    labs(x = "x", y = "y",
         title = "Social distancing paths",
         subtitle = "The ribbons indicate the 6 ft radius\naround each person")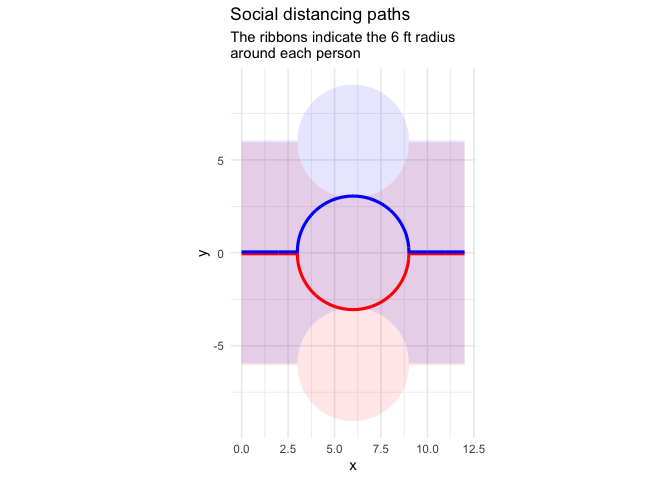
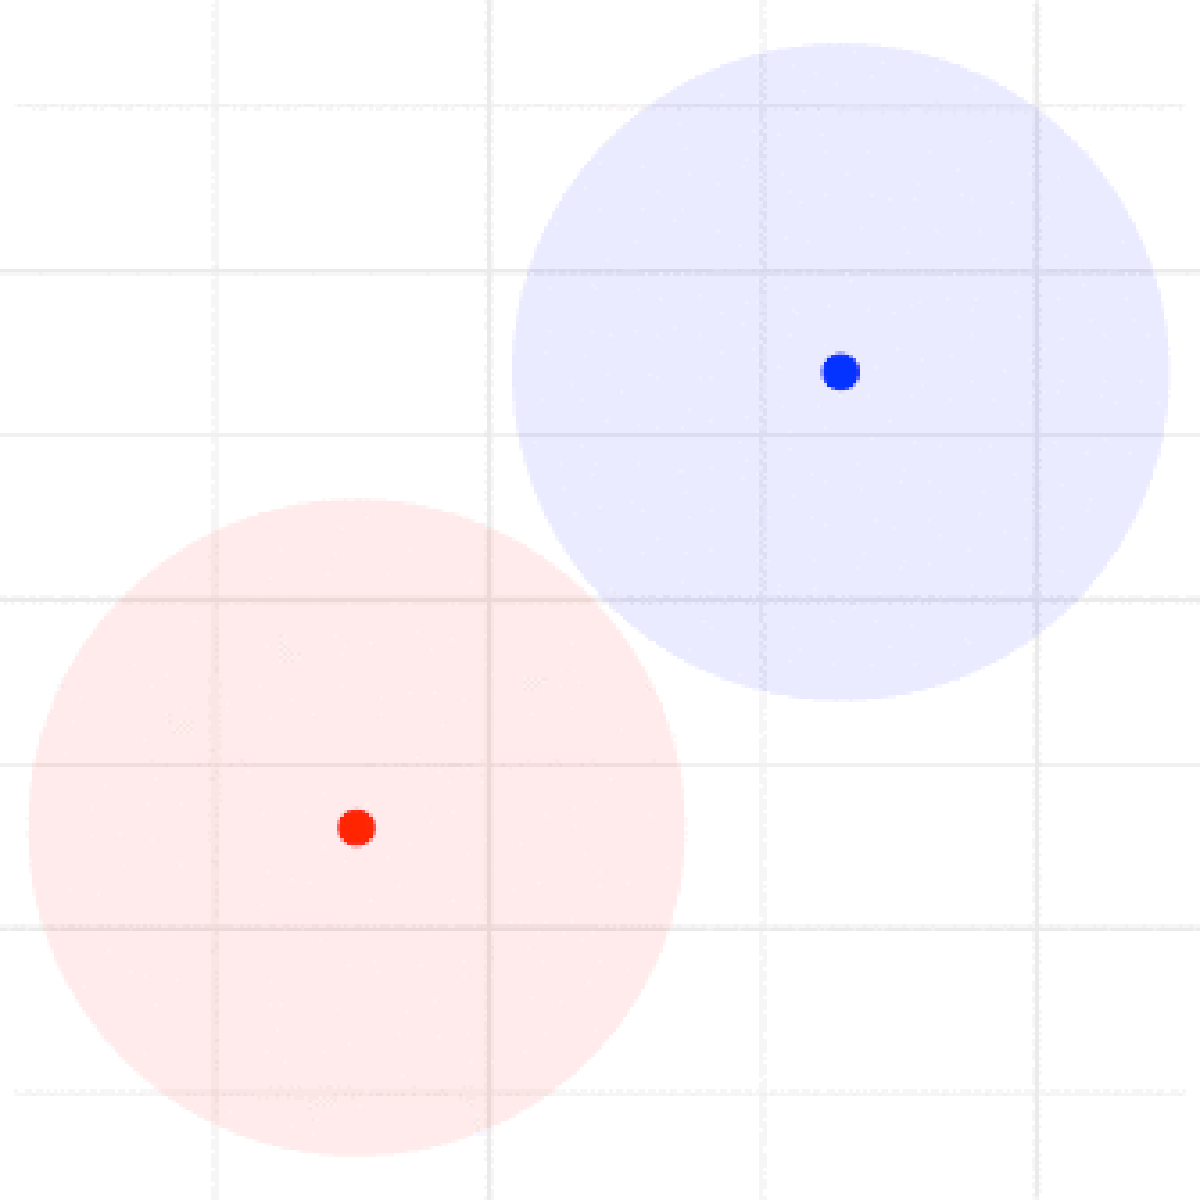
I used ‘gganimate’ to show the two people walking towards each other with their 6-foot social distancing guides.
ppl_tracker %>%
    mutate(y_A = y_A - 0.05,
           y_B = y_B + 0.05) %>%
    filter(row_number() %% 20 == 0) %>%
    ggplot() +
    geom_point(aes(x = x_A, y = y_A), color = "red", size = 3) +
    geom_point(aes(x = x_B, y = y_B), color = "blue", size = 3) +
    geom_circle(aes(x0 = x_A, y0 = y_A, r = minimum_distance / 2),
                fill = "red", alpha = 0.1, color = NA) +
    geom_circle(aes(x0 = x_B, y0 = y_B, r = minimum_distance / 2),
                fill = "blue", alpha = 0.1, color = NA) +
    coord_equal() +
    labs(x = "x", y = "y", title = "Social distancing paths") +
    transition_states(t, transition_length = 0.01,
                      state_length = 0, wrap = FALSE)
Total distance traveled#
Finally, as the Riddler requested, I calculated the total distance
traveled by person A.
total_distance <- 0
for (i in seq(2, nrow(A_tracker))) {
    a <- c(A_tracker$x[[i - 1]], A_tracker$y[[i - 1]])
    b <- c(A_tracker$x[[i]], A_tracker$y[[i]])
    total_distance <- total_distance + measure_distance(a, b)
}

total_distance <- round(total_distance, 1)
Each person travels a total of 15.7 ft, 3.7 more feet than without the need for social distancing.