FiveThirtyEight’s Riddler Express#
Dakota Jones is back in action. In her quest to locate the Temple of Diametra, she has found another highly symmetric crystal. However, nefarious agents have again gotten wind of her plans, and now Dakota and the crystal are nowhere to be found.
And so, you must once again recreate the crystal using the data from Dakota’s laser scanner. As a reminder, the scanner takes a 3D object and records 2D cross-sectional slices along the third dimension. Here’s the looping animation file the scanner produced for the crystal this time:

What sort of three-dimensional shape is the crystal? No pressure — Dakota Jones, nay, the entire world, is counting on you to locate the lost temple!
Plan#
My plan is to read in the slices of the GIF, extract the information as a binary mask, identify the corners of the maks, and plot these corners in 3D-space.
Setup#
knitr::opts_chunk$set(echo = TRUE, comment = "#>")

library(plotly)
library(htmlwidgets)
library(tidyverse)

theme_set(theme_minimal())
Preparing the image data#
I read in the GIF image data using the read.gif() function from the
‘caTools’ package.
gif_path <- file.path("assets", "crystal_538.gif")
gif <- caTools::read.gif(gif_path)
#> Warning in caTools::read.gif(gif_path): write.gif: file 'assets/crystal_538.gif'
#> contains multiple color-maps. Use 'frame' > 0.
The image is contained as a 3D matrix in the image slot. The image
matrix is numeric where each number corresponds to a color in the slice.
names(gif)#> [1] "image" "col" "transparent" "comment"
dim(gif$image)#> [1] 558 586 101
gif$image[1:5, 1:5, 1:3]#> , , 1
#>
#> [,1] [,2] [,3] [,4] [,5]
#> [1,] 0 0 0 0 0
#> [2,] 0 0 0 0 0
#> [3,] 0 0 0 0 0
#> [4,] 0 0 0 0 0
#> [5,] 0 0 0 0 0
#>
#> , , 2
#>
#> [,1] [,2] [,3] [,4] [,5]
#> [1,] 2 2 2 2 2
#> [2,] 2 2 2 2 2
#> [3,] 2 2 2 2 2
#> [4,] 2 2 2 2 2
#> [5,] 2 2 2 2 2
#>
#> , , 3
#>
#> [,1] [,2] [,3] [,4] [,5]
#> [1,] 1 1 1 1 1
#> [2,] 1 1 1 1 1
#> [3,] 1 1 1 1 1
#> [4,] 1 1 1 1 1
#> [5,] 1 1 1 1 1
The built-in image() function can plot a matrix of numeric values.
image(gif$image[, , 21])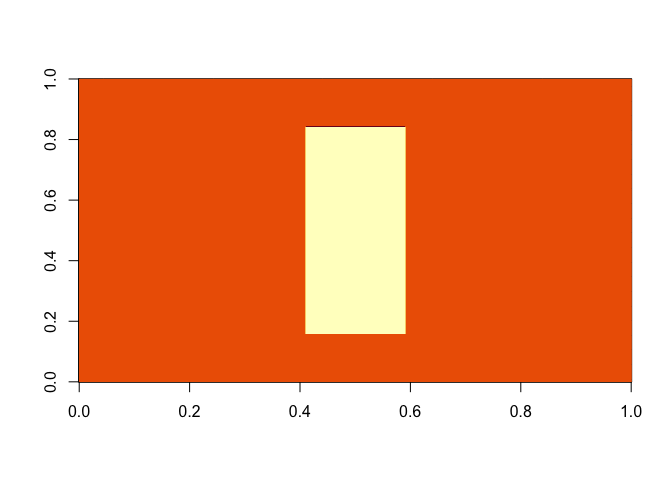
I expected to only find two colors, the foreground and background, but the edge of the foreground and background sometimes had a slightly different color.
table(gif$image[, , 20])#>
#> 0 1 2
#> 38164 288012 812
table(gif$image[, , 21])#>
#> 0 1 2 3
#> 40000 802 285986 200
table(gif$image[, , 22])#>
#> 0 1 2
#> 41184 285012 792
Luckly, the foreground always had the color 0. Therefore, I made a
copy of the gif$image where all the 0 values were TRUE and the rest
were FALSE.
img <- gif$image
img <- img == 0
Finally, the first and last frames are empty, so I removed them.
img <- img[, , -c(1, 101)]‘Tidy’ the image data#
I wanted to put the image data into a tidy format so that each row was a
data point with columns x, y, and z (the slice of the GIF) for the
data point’s coordinates and a column value for the value (either
TRUE or FALSE) of the point. This was done by the get_tidy_xy()
funciton that takes an index for which to slice img.
Then, I needed to get just the corners of the mask. Thankfully, this was
easy because all of the individual shages were rectangles. Therefore, I
could just filter for the points at the minimum and maximum x values
and then the minimum and maximum y values. This was done by
get_mask_corners() that takes a tidy data frame like that produced by
get_tidy_xy().
Both of these functions were used in tandem to produce the tidy_img
tibble.
get_tidy_xy <- function(i) {
    m <- img[, , i]
    colnames(m) <- as.character(seq(1, ncol(m)))
    as.data.frame(m) %>%
        as_tibble() %>%
        mutate(y = 1:n()) %>%
        pivot_longer(-y, names_to = "x", values_to = "value") %>%
        mutate(x = as.numeric(x))
}


get_mask_corners <- function(df) {
    df %>%
        filter(value) %>%
        filter(x == min(x) | x == max(x)) %>%
        filter(y == min(y) | y == max(y))
}


tidy_img <- tibble(z = seq(1, dim(img)[3])) %>%
    mutate(xy = map(z, get_tidy_xy),
           xy = map(xy, get_mask_corners)) %>%
    unnest(xy)

tidy_img
#> # A tibble: 396 x 4
#> z y x value
#> <int> <int> <dbl> <lgl>
#> 1 1 278 46 TRUE
#> 2 1 278 541 TRUE
#> 3 1 281 46 TRUE
#> 4 1 281 541 TRUE
#> 5 2 275 49 TRUE
#> 6 2 275 538 TRUE
#> 7 2 284 49 TRUE
#> 8 2 284 538 TRUE
#> 9 3 273 51 TRUE
#> 10 3 273 536 TRUE
#> # … with 386 more rows
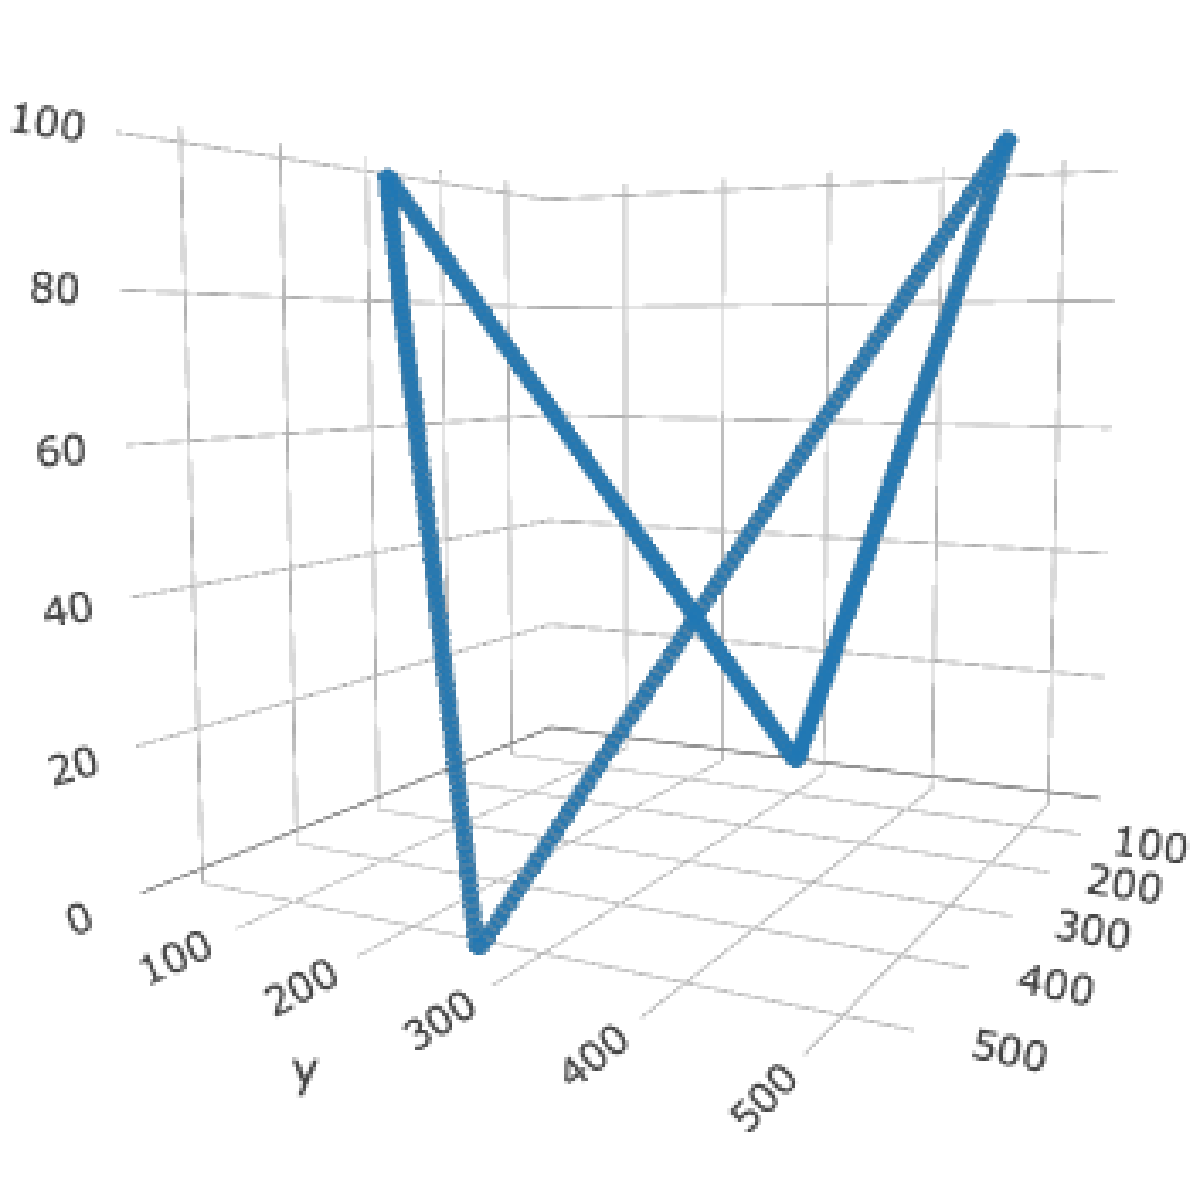
I used the ‘ggforce’ library to plot the first few layers, individually, before going to 3D.
tidy_img %>%
    filter(z %in% 1:9) %>%
    ggplot(aes(x = x, y = y, group = z)) +
    facet_wrap(~ z) +
    ggforce::geom_shape() +
    scale_x_continuous(breaks = c(100, 300, 500)) +
    scale_y_continuous(breaks = c(100, 300, 500)) +
    theme(
        panel.grid = element_line()
    ) +
    labs(x = "x", y = "y",
         title = "Surfaces through the image",
         subtitle = "Each plot is a slice of the gif")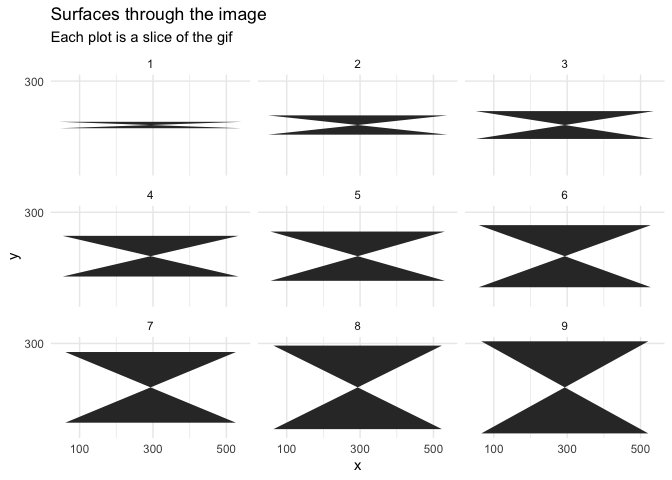
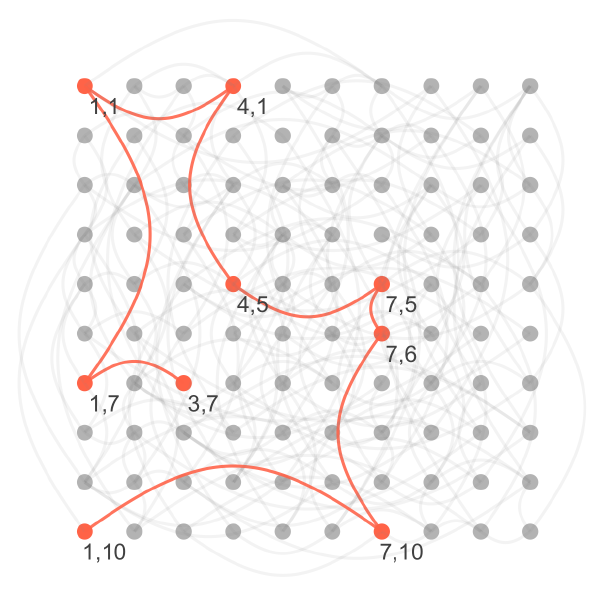
Instead of nice rectangles, this produced a bow-tie shape. This was
because of the order of the points - they weree not in the correct order
to draw a rectangle, but instead the top-left point was followed by the
bottom-right point, causing the diagonal. Therefore, the
arrange_tidy_xy() function just rearranges each coordinate to properly
draw a rectangle.
arrange_tidy_xy <- function(df) {
    df <- df[c(1, 2, 4, 3), ]
}

tidy_img <- tidy_img %>%
    group_by(z) %>%
    nest() %>%
    mutate(data = map(data, arrange_tidy_xy)) %>%
    unnest(data)

tidy_img
#> # A tibble: 396 x 4
#> # Groups: z [99]
#> z y x value
#> <int> <int> <dbl> <lgl>
#> 1 1 278 46 TRUE
#> 2 1 278 541 TRUE
#> 3 1 281 541 TRUE
#> 4 1 281 46 TRUE
#> 5 2 275 49 TRUE
#> 6 2 275 538 TRUE
#> 7 2 284 538 TRUE
#> 8 2 284 49 TRUE
#> 9 3 273 51 TRUE
#> 10 3 273 536 TRUE
#> # … with 386 more rows
tidy_img %>%
    filter(z %in% round(seq(1, 99, length.out = 25))) %>%
    ggplot(aes(x = x, y = y, group = z)) +
    facet_wrap(~ z) +
    ggforce::geom_shape() +
    scale_x_continuous(breaks = c(100, 300, 500)) +
    scale_y_continuous(breaks = c(100, 300, 500)) +
    theme(
        panel.grid = element_line()
    ) +
    labs(x = "x", y = "y",
         title = "Surfaces through the image",
         subtitle = "Each plot is a slice of the gif")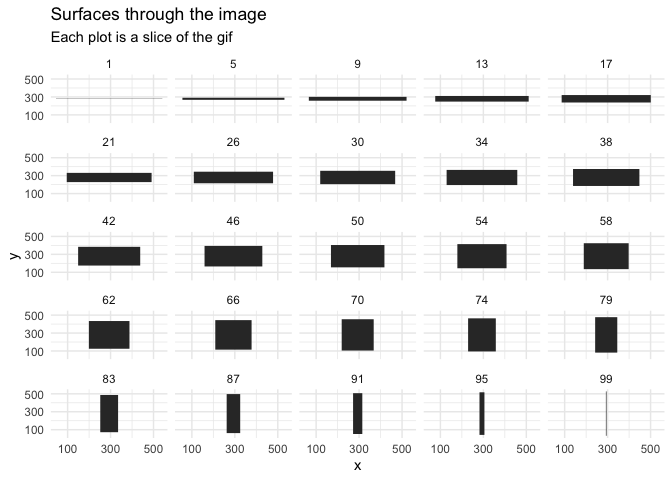
3D Plotting#
Finally, I could plot the points in 3D to create the shape of “Dakota Jones’ crystal” as the Riddle requests. The code is followed by a GIF of the output plotly figures.
plot_ly(data = tidy_img, x = ~x, y = ~y, z = ~z, size = 1,
        mode = "markers", opacity = 1.0, type = "scatter3d")
plot_ly(data = tidy_img, x = ~x, y = ~y, z = ~z, type = "mesh3d")